Yet, another exciting year, learning new skills and meeting new people, here are some highlights of 2016 :
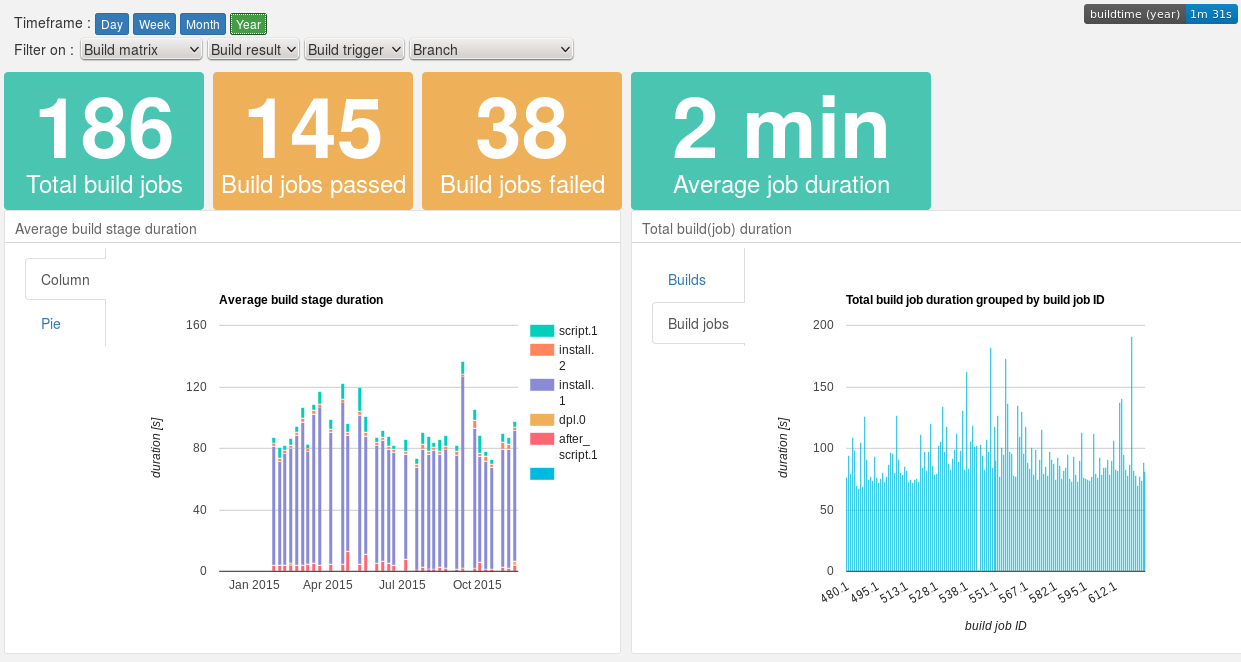
- visited FOSDEM; giving a lightning talk about Buildtime Trend; meeting Rouslan, Eduard, Ecaterina and many others
- attended a Massive Attack concert in Paleis 12.
- visited Mount Expo, the outdoor fair organised by KBF
- saw some amazing outdoor films on the BANFF film festival
- spent a weekend cleaning routes with the Belgian Rebolting Team (BRT) in Comblain-La-Tour. On Sunday we did some climbing in Les Awirs, where I finished a 6b after trying a few times.
- First time donating blood plasma
- First academic publication (as co-author) : https://biblio.ugent.be/publication/7204792
- Climbing trip to Gorges du Tarn with Vertical Thinking : climbing 6 days out of 7 (one day of rain), doing multipitch Le Jardin Enchanté, sending a lot of 5, 6a and 6a+ routes, focusing on reading the route, looking for footholds and taking small steps.
- Some more route cleaning with BRT, this time in Flône, removing loose rock and preparing to open new routes.
- went to DebConf16 in CapeTown, talking about 365 days of Open Source (video) and made a first contribution to Debian.
- Visited South Africa and climbed in Rocklands/Cederberg
- became a (Junior Developer) member of the Debian MySQL Maintainers Team
- 10th blood/plasma donation
- visited Amsterdam for the MariaDB developers meetup
- climbing trip to Orpierre in France. It was cold during the night, but as soon as the sun came out it was T-shirt weather. Plenty of climbing with Adriaan, Mathias, Bert, Stijn en Corentin (a local French climber) : a very nice multipitch (Diedre Sud, 7 5b/5c pitches) and quite a few 5's en 6's single pitch routes, with a few 6a's leading and 2 6b's toprope.
- Another cleaning weekend with BRT, learning how to glue bolts. Slipped on a greasy forest trail and bruised a rib.
- went to 33C3 in Hamburg : 4 days of talks about IT, technology, science, security and privacy.
- celebrating New Year's Eve in Ghent with some friends, good food and an exciting quiz
Plans for 2017 :
- Clean some rock with BRT, climb, both indoor and do a few climbing trips
- Conferences : FOSDEM, DebConf, FrosCon, 34C3
- Contribute to Debian and MariaDB