Showing posts with label Travis CI. Show all posts

Tuesday, November 24, 2015

Buildtime Trend v0.3 is out

Visualise what's trending in your build process

Buildtime Trend Logo
I'm happy to inform you that Buildtime Trend v0.3 is released. Those of you using Buildtime Trend as a Service had a running preview of all the new features :

  • introduction of a worker queue to make processing build job logs more scalable
  • dashboard chart data can be filtered on build properties 
  • several new dashboard charts and layout improvements
  • enable Keen.io query caching to improve chart loading speed
  • the dashboard takes url parameters to set the refresh rate and the default settings for time interval and filter properties
  • a statistics dashboard is added to monitor usage of Buildtime Trend as a Service
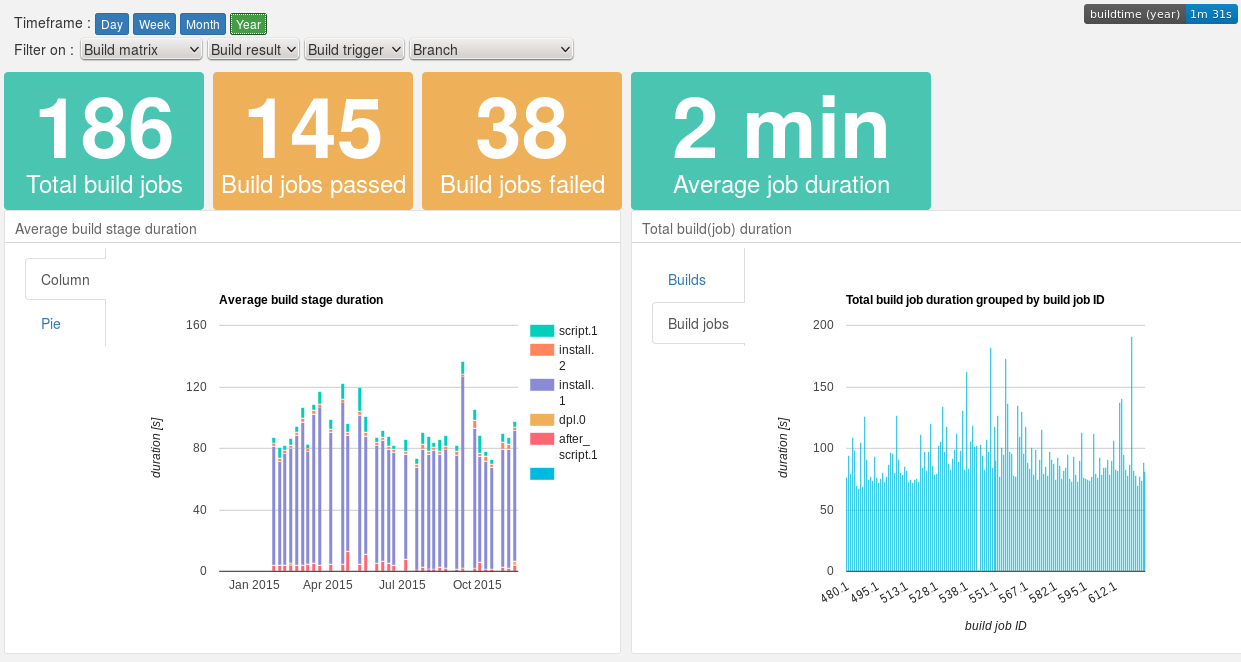
Dashboard example
Dashboard example
More new features, improvements and changes can be found in the release notes and the Changelog files of the project components :
You can check out the dashboards of the projects that are already using Buildtime Trend as as Service :


Do you want to enable Buildtime Trend for your the build process of your project on Travis CI? It is easy to set up.

Buildtime Trend as a Service is currently available for free for Open Source projects, thanks to the kind people of Keen.io.

Donate

If you like Buildtime Trend, you are welcome to support the project, by making a donation. Donations will help pay for the hosting and support further development.

You can help make the project better : we welcome any kind of contributions.

Sunday, February 22, 2015

Buildtime Trend v0.2 released!

Visualise what's trending in your build process

Buildtime Trend Logo
What started as a few scripts to gain some insight in the duration of stages in a build process, has evolved into project Buildtime Trend, that generates and gathers timing data of build processes. The aggregated data is used to create charts to visualise trends of a build process.

The major new futures are the support for parsing Travis CI build log files to retrieve timing data and the introduction of the project as a service that gathers Travis CI generated timing data, hosts a dashboard with different charts and offers shield badges with different metrics.

Try it out!

The hosted service supports Open Source projects (public on GitHub) running their builds on Travis CI. Thanks to the kind people of Keen.io hosting the aggregated data, the hosted service is currently available for free for Open Source projects.
Get started! It's easy to set up in a few steps.

A bit more about Buildtime Trend

Dashboard example
Dashboard example
Buildtime Trend is an Open Source project that generates and gathers timing data of build processes. The aggregated data is used to create charts to visualise trends of the build process.
These trends can help you gain insight in your build process : which stages take most time? Which stages are stable or have a fluctuating duration? Is there a decrease or increase in average build duration over time?
With these insights you can improve the stability of your build process and make it more efficient.

The generation of timing data is done with either a client or using Buildtime Trend as a Service.
The Python based client generates custom timing tags for any shell based build process and can easily be integrated. A script processes the generated timing tags when the build is finished, and stores the results.
Buildtime Trend as a Service gets timing and build related data by parsing the logfiles of a buildprocess. Currently, Travis CI is supported. Simply trigger the service at the end of a Travis CI build and the parsing, aggregating and storing of the data is done automatically.

The aggregated build data is used to generate a dashboard with charts powered by the Keen.io API and data store.

Check out the website for more information about the project, follow us on Twitter, or subscribe to the community mailing list.