Tuesday, August 21, 2018

This was 2018!

Well, an intense 2018 : traveling and climbing with old and new friends, making steady progress in climbing level, learning new techniques, practising and refining them, both in climbing and professionally :
  • FOSDEM
  • Config management Camp in Ghent
  • Climbing in Gorges du Tarn en Gorges de la Jonte with Vertical Thinking, including two multipitches (Le jardin enchanté, and diagonal du Gogol)
  • Climbing in Fontainebleau with Alex and Tom, doing lots of yellow, orange and blue routes in L'éléphant, Apremont and Roche aux sabots.
  • Climbing trip to Ettringen, practicing some trad techniques, first time climbing Basalt
  • Climbing trip with Vertical Thinking to Guillestre (Haut Val Durance), doing 2 nice multipitches (4-5 pitches including a 6a)
  • Climbing day with Koen and Wouter in Moha
  • Visiting Romania (Moldova and Transilvania region) with Eduard and Ecatarina : Lady's rock, Vatra Dornei, Dochia Caban and Toaca Peak, Transfagarasan, Sighisoara, Bran castel, Brasov, Iasi
  • Short citytrip in Vienna (during a 22h layover between two flights)
  • Multipitch climbing with Koen in Yvoir, also exploring Anhée
  • Climbing training working towards 6c.
  • Percona Live Europe in Frankfurt
  • Climbing trip to Siurana with Rouslan and Rat : leading my first 6b (redpoint), 6b+ toprope and projecting a 7a
  • Quick visit to Barcelona
  • Visiting 35C3 conference in Leipzig, another 4 days of infosec, IT, technology and science. First year as an 'angel', volunteering to help with some tasks at the conference. Unfortunately, bound to my hotel room due to illness for half of the conference. Luckily, all talks are recorded and streamed, so I could I could follow a few from my bed : https://media.ccc.de
  • Spending New Year's Eve in a doctor's office and looking for a pharmacy, due to earlier mentioned illness.

Plans for 2019 :
- more climbing : training for 6c/7a, fall-training to get more comfortable while leading, climbing trip to Buis-les-baronies in April, maybe a trip to Boulder, Colorado, possibly an alpine experience in the summer or a climbing trip in the US west coast in autumn
- continue Rock maintenance with Belgian Rebolting Team.
- find a new house, preferably with a small garden
- conferences : FOSDEM, Config Management  Camp, Percona Live (Austin, Texas), Percona Live Europe, 36C3
- first time Rock Werchter (Tool is coming)

Monday, January 01, 2018

Overview of 2017

Well, 2017 was exciting! A new job and a lot of climbing in Belgium, California and France : KVB4 training, crag maintenance weekends with BRT, trips to Fontainebleau and Freyr :

  • First BRT weekend of the year : exploration and first works in new climbing site in Spontin, some langlaufing on Sunday
  • FOSDEM 2017
  • Got selected for a sysadmin position at the ICT department of Ghent University
  • Joining BRT on Sunday for climbing in Freyr
  • More rock maintenance in Spontin, climbing a few routes in Pont-a-Lesse on Sunday
  • Climbing in Gorge du Tarn and Gorge de la Jonte with Vertical Thinking, leadclimbing up to 6a, finished a 6a+ toprope (Fuck the Curve, De Que Fas a Qui), 3 multipitches (Jardin Enchanté, Roc d'Aiguile, Le Bitard), discovered a nice and quiet climbing area at the end of the Jonte valley, called Pauparelle, close to Meyrueis, well equiped, 4 to 6a)
  • Introducing Alex and Tom to bouldering in Fontainebleau during a 4 day climbing trip.
  • Second trip to Fontainebleau with Alwyn, Pieter and Maene.
  • Started working as Linux System Administrator at the ICT department (DICT) of Ghent University
  • Icinga2 training in Amsterdam
  • Trip to Le Marche in Italy, visiting Rome and Milan on the way home by train.
  • KVB4 training in La Bérarde, learning basics of trad climbing, using mobile protection, (self) rescue techniques, a lot of knots (HMS and Alpine slipknot to the rescue!) and tips and tricks to avoid tricky situations when climbing in semi-alpine areas and how to get out of them.
  • Climbing trip to California, visiting Yosemite, Bishop and Joshua Tree, being fortunate to meet some nice people to climb with. It was a nice combination of comfortable sports climbing (Owens River Gorge), getting some experience in trad and crack climbing in Yosemite, and toproping harder crack climbing routes in J-Tree.
  • positive final evaluation for the trial period in my new Linux Sysadmin position
  • Visited 34C3, for the first time in Leipzig. Yet again an interesting 4 days of conference on IT, security, policy and science.

Plans for 2018 :
  • More crag maintenance with BRT and climbing (trad), maybe another climbing trip to California or multipitch climbing in France
  • Conferences : FOSDEM, 35C3
  • Pick up on contributing to Open Source again

Climbing in California 2017

From October 25th 2017 to November 9th 2017, I went to California on a climbing trip. The goal was to build experience in trad and crack climbing and explore some climbing areas :

Yosemite

Day 1 : Glacier Point Apron

With Patricia

  • Harry Daley (5.8, 2 pitches)

Day 2 : Swan Slab 

With Rhea and Dan :
  • Oak Tree Flake (5.6) : trad lead
  • Grant's Crack (5.9)
  • Lena's Lieback (5.9)
  • Claude's delight (5.7)
With Rhea :
  • Unnamed Crack (5.9) * : first trad lead while placing gear
  • Unnamed Crack (5.7) *
* Swan Slab, route E (5.7) and F (5.9) in Super Topo Yosemite Valley Free climbs (p. 96)

Bishop

Day 1 : Owens river Gorge (Central Gorge)

With Spence and Sierra, bolted routes

Warm Up wall

Great Wall of China - Left

  • Enter the dragon (5.8)
  • China Doll (5.8)

Day 2 : Owens river Gorge (Upper Gorge)

With Spence and Sierra, bolted routes

Upper Elbow Room

  • For Patricia (5.7)
  • Frank (5.9)
  • Stella (5.8) : very fun!

Joshua Tree

Day 1 : IRS wall

With Patricia and Dave

  • Tax Man (5.10a)
  • Bloody Tax Break (5.10b)

Day 2 : Hemingway Buttress

With Patricia and Dave

  • Poodles are people too (5.10b)

Sunday, January 01, 2017

This was 2016!

Yet, another exciting year, learning new skills and meeting new people, here are some highlights of 2016 :
  • visited FOSDEM; giving a lightning talk about Buildtime Trend; meeting Rouslan, Eduard, Ecaterina and many others
  • attended a Massive Attack concert in Paleis 12.
  • visited Mount Expo, the outdoor fair organised by KBF
  • saw some amazing outdoor films on the BANFF film festival
  • spent a weekend cleaning routes with the Belgian Rebolting Team (BRT) in Comblain-La-Tour. On Sunday we did some climbing in Les Awirs, where I finished a 6b after trying a few times.
  • First time donating blood plasma
  • First academic publication (as co-author) : https://biblio.ugent.be/publication/7204792
  • Climbing trip to Gorges du Tarn with Vertical Thinking : climbing 6 days out of 7 (one day of rain), doing multipitch Le Jardin Enchanté, sending a lot of 5, 6a and 6a+ routes, focusing on reading the route, looking for footholds and taking small steps.
  • Some more route cleaning with BRT, this time in Flône, removing loose rock and preparing to open new routes.
  • went to DebConf16 in CapeTown, talking about 365 days of Open Source (video) and made a first contribution to Debian.
  • Visited South Africa and climbed in Rocklands/Cederberg
  • became a (Junior Developer) member of the Debian MySQL Maintainers Team
  • 10th blood/plasma donation
  • visited Amsterdam for the MariaDB developers meetup
  • climbing trip to Orpierre in France. It was cold during the night, but as soon as the sun came out it was T-shirt weather. Plenty of climbing with Adriaan, Mathias, Bert, Stijn en Corentin (a local French climber) : a very nice multipitch (Diedre Sud, 7 5b/5c pitches) and quite a few 5's en 6's single pitch routes, with a few 6a's leading and 2 6b's toprope.
  • Another cleaning weekend with BRT, learning how to glue bolts. Slipped on a greasy forest trail and bruised a rib.
  • went to 33C3 in Hamburg : 4 days of talks about IT, technology, science, security and privacy.
  • celebrating New Year's Eve in Ghent with some friends, good food and an exciting quiz

Plans for 2017 :
  • Clean some rock with BRT, climb, both indoor and do a few climbing trips
  • Conferences : FOSDEM, DebConf, FrosCon, 34C3
  • Contribute to Debian and MariaDB

Thursday, June 09, 2016

You can learn anything you want

This morning I was reminded that, 4 years ago, I was looking for a project to get some experience with Java, C or C++.
Looking back, I started working on an Getback GPS, an Android app (learning some Java) and later on another project called Buildtime Trend, which gave me some Python and JavaScript experience.
So in 4 years, I started 2 Open Source projects, learned 3 new programming languages, and some other technologies and frameworks along the way.

I can say I learned a lot the last few years, on a technical level, but it also made me realise that it is possible to learn new things, if you set your mind to it. You just have to start doing it, try things, fail, learn from it, try again, read a tutorial, look for questions and answers (fe. on Stack Overflow), go to conferences, talk to experienced people, join a project that uses the technology you want to learn.

And this is not limited to technology. Want to learn a musical instrument? How to make a cake? How to become a great speaker? Learn to swim longer or faster?

This is all possible. You just have to start doing it and practice. Taking small steps at the start. Allow yourself to fail, but learn from it and improve. You might need some guidance or coaching, or take a course to give you a headstart.

I'm not saying it won't be hard, sometimes you keep failing, stop making progress and you get frustrated. And that's a time to take a step back, monitor your progress, examine the goals you have set yourself. Are you doing it the right way? Can it be done differently? Do you have all the required skills to make progress? Maybe you need to practise something else first?

Anyway, keep the end goal in mind, take small steps and enjoy  the journey. Enjoying what you are doing or achieving is an important motivator.
If you set your mind to it, you can learn anything you want.

Which reminds of this video, how to learn anything in 20 hours :


Saturday, May 21, 2016

Some guidelines for writing better and safer code

Recently, I came across some code of a web application that, on brief inspection, was vulnerable to XSS and SQL injection attacks : the SQL queries and the HTML output were not properly escaped, the input variables were not sanitized. After a bit more reviewing I made a list of measures and notified the developer who quickly fixed the issues.

I was a bit surprised to come across code that was very insecure, which took the author only a few hours to drastically improve with a few simple changes. I started wondering why the code wasn't of better quality in the first place? Did the developer not know about vulnerabilities like SQL injection and how to prevent them? Was it time pressure that kept him from writing safer code?

Anyway, there are a few guidelines to write better and safer code.

Educate yourself

As a developer you should familiarize yourself with possible vulnerabilities and how to avoid them. There are plenty of books and online tutorials covering this. A good starting point is the Top 25 Most Dangerous Software Errors list. Reading security related blogs and going to conferences (or watch talks online) is useful as well.

Use frameworks and libraries

About every language has a framework for web applications (Drupal, Symfony (PHP), Spring (Java), Django (Python), ...) that has tools and libraries for creating forms, sanitizing input variables, properly escaping HTML output, handling cookies, check authorization and do user and privileges management, database-object abstraction (so you don't have to write your own SQL queries) and much more.
Those frameworks and libraries are used by a lot of applications and developers, so they are tested much more than code you write yourself, so bugs are found more quickly.

It is also important to regularly update the libraries and frameworks you use, to have the latest bugs and vulnerabilities fixed.

Code review

More people see more than one. Have your code reviewed by a coworker and use automated tools to check your code for vulnerabilities. Most IDEs have code checking tools, or you can implement them in a Continuous Integration (CI) environment like Jenkins, Travis CI, Circle CI, ... to check your code during every build.
A lot of online code checking tools exist that can check your code every time you push your code to your version control system.
There is no silver bullet here, but a combination manual code review and automated checks will help to spot vulnerabilities sooner.

Test your code

Code reviewing tools can't spot every bug, so testing your code is important as well. You will need automated unit tests, integration tests, ... so you can test your code during every build in you CI environment.
Writing good tests is an art and takes time, but more tests means less possible bugs remaining in your code.

Coding style

While not directly a measure against vulnerabilities, using a coding style that is common for the programming language you are using, makes your code more readable both for you, the reviewer and future maintainers of your code. Better readability makes it easier to spot bugs, maintain code and avoid new bugs.


I guess there are many more ways to improve code quality and reduce vulnerabilities. Feel free to leave a comment with your ideas.


Friday, January 01, 2016

This was 2015 and plenty to do in 2016!

2015 was an amazing year, learning a lot and making some progress in my Open Source development and climbing activities.
Buildtime Trend keeps growing, with Angular and a Facebook Open Sourced project as new users, improving my Python and JavaScript skills, setting up a CherryPy based service on Heroku, backed by a Celery/RabbitMQ task queue to make the service more responsive.

I have no real resolutions for 2016, I'll just spend my time on climbing and Open Source software development, learning new skills along the way and putting them into practice :

  • use Ansible (or another configuration management tool) to provision a Vagrant based development environment for Buildtime Trend
  • start using Django to add user management to Buildtime Trend as a Service
  • learn how to climb safely in less equiped areas using friends, nuts, and other mobile protection
  • apply the lessons learned form "The Rock Warrior's Way' while climbing
  • visit a few conferences : FOSDEM, 33C3 and Newline, and maybe some more : LinuxTag, DebConf, FossAsia, KeenCon, ...
  • do some improvements to my house

Plenty to do in 2016! I wish anyone an joyful year full of insights and opportunities to learn and improve.
And remember, it's all about enjoying the journey!


Here are some highlights from 2015 :
  • Celebrated New Year in Lisbon.
  • Reached a 365 day commit streak contributing to Open Source projects, with 2300+ commits over that period.
  • visited FOSDEM 2015, another great weekend of Open Source enthousiast meeting and sharing knowledge in Brussels, with over 500 speakers and 5-10.000 visitors. Happy to meet Eduard and Ecaterina again who came over from Romania, and many others.
  • Buildtime Trend was mentioned in the Black Duck newsletter 
  • Buildtime Trend made it to the top 3 of hot projects on OpenHub
  • Reached the most active developers top 10 on OpenHub
  • Released Buildtime Trend v0.2 and launched a Heroku app hosting the service.
  • Visited Cork and Dublin with Sofie, attending Jeroen's PhD graduation ceremony and meeting Rouslan and his friends.
  • Attended Newline 0x05 and did two talks : Buildtime Trend : Visualise what's trending in your build process and What I learned from 365 days of contributing to Open Source projects
  • Ended my commit streak after 452 days
  • Went on a climbing trip to Gorges du Tarn
  • Flashed my first 6a lead climbing on rock.
  • Traveled to the US, East coast this time, visiting Washington DC, meeting Lieven H and Wim, exploring New York City with Tine, Lukas and Marie-Hélène.
  • One-day climbing trip to Freyr with Peter.
  • And another climbing trip to Beez with Lieven V, Ben, Patrick and others.
  • 4th blood donation, convinced Tine to join me for her first donation! Well done!
  • Deployed a Celery/RabbitMQ based worker to Buildtime Trend as a Service on Heroku, taking some load off the webservice and improving the response times.
  • Climbing trip to La Bérarde, with Bleau, doing my first multipitches (Li Maye laya and Pin Thotal) with Mariska and lead climbing a few 6a+ routes. Weather was great, atmosphere was superb, climbing was fun!
  • Went to Fontainebleau for the birtdayparty of Andreas. Great fun, nice people, lots of routes. Finished my first red route in Fontainebleau.
  • Travelled to California and made roadtrip from San-Francisco, to Yosemite, over Tioga Pass to Mojave Dessert, Red Rock Canyon, Las Vegas, Zion National Park, Bryce Canyon, Grand Canyon and flying back from Phoenix to San-Francisco. I did some climbing and hiking, took a climbing course on using cams and nuts. On the way I met a lot of nice people, with whom I had interesting conversations.
  • Released Buildtime Trend v0.3
  • Finished online Stanford University course Algorithms: Design and Analysis, Part 1
  • Read The Rock Warrior's Way, a must read for any climber
  • Visited 32C3 in Hamburg, 4 days of lectures, writing software and talking to other developers. It was amazing, next year again!

Tuesday, November 24, 2015

Buildtime Trend v0.3 is out

Visualise what's trending in your build process

Buildtime Trend Logo
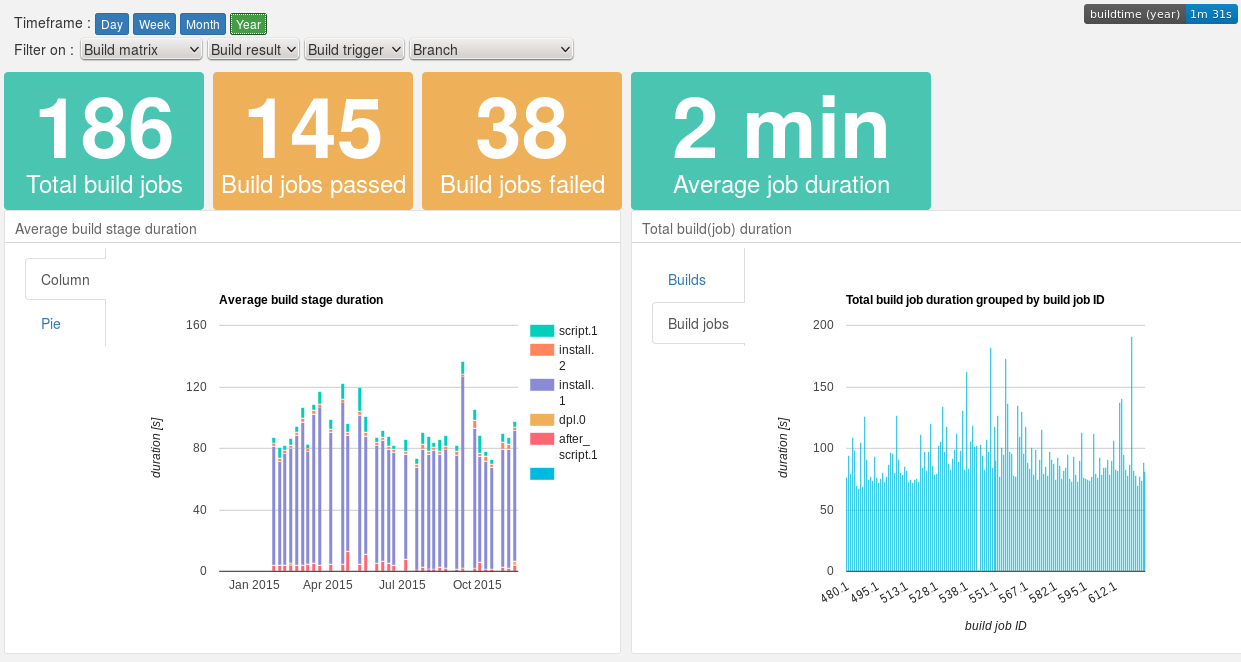
I'm happy to inform you that Buildtime Trend v0.3 is released. Those of you using Buildtime Trend as a Service had a running preview of all the new features :

  • introduction of a worker queue to make processing build job logs more scalable
  • dashboard chart data can be filtered on build properties 
  • several new dashboard charts and layout improvements
  • enable Keen.io query caching to improve chart loading speed
  • the dashboard takes url parameters to set the refresh rate and the default settings for time interval and filter properties
  • a statistics dashboard is added to monitor usage of Buildtime Trend as a Service
Dashboard example
Dashboard example
More new features, improvements and changes can be found in the release notes and the Changelog files of the project components :
You can check out the dashboards of the projects that are already using Buildtime Trend as as Service :


Do you want to enable Buildtime Trend for your the build process of your project on Travis CI? It is easy to set up.

Buildtime Trend as a Service is currently available for free for Open Source projects, thanks to the kind people of Keen.io.

Donate

If you like Buildtime Trend, you are welcome to support the project, by making a donation. Donations will help pay for the hosting and support further development.

You can help make the project better : we welcome any kind of contributions.

Tuesday, April 21, 2015

Gorges du Tarn 2015

It was an amazing week, climbing in Gorges du Tarn with Bleau Climbing team during the second week of the Easter holiday.
Beautiful weather, nice people, good atmosphere, a lot of climbing, some personal bests and climbing improvements on both a physical and mental level.

Some impressions :

  • Flashed my first 6a lead climbing on rock : Nique le lière in the Figues au Cul sector.
  • Cooked spaghetti for approx. 50 people with a great team (Peter, Lieven, Hanne, Anneke, Jasper and Tim)
  • Finished a lot of 5s on sight or flashed them.
  • Discovered that my tent isn't waterproof anymore. Luckily there was a bridge that kept part of the camping site dry, so I moved my tent there during the rainy night. Yes, I slept under a bridge. ;)
  • Almost finished a 6a+ on Noir Désir and started working in a very exciting 6c on La Muse, two projects for next time, so I know what I'll be training for the next few months. :)
Great trip, looking forward to the next one!

Sunday, February 22, 2015

Buildtime Trend v0.2 released!

Visualise what's trending in your build process

Buildtime Trend Logo
What started as a few scripts to gain some insight in the duration of stages in a build process, has evolved into project Buildtime Trend, that generates and gathers timing data of build processes. The aggregated data is used to create charts to visualise trends of a build process.

The major new futures are the support for parsing Travis CI build log files to retrieve timing data and the introduction of the project as a service that gathers Travis CI generated timing data, hosts a dashboard with different charts and offers shield badges with different metrics.

Try it out!

The hosted service supports Open Source projects (public on GitHub) running their builds on Travis CI. Thanks to the kind people of Keen.io hosting the aggregated data, the hosted service is currently available for free for Open Source projects.
Get started! It's easy to set up in a few steps.

A bit more about Buildtime Trend

Dashboard example
Dashboard example
Buildtime Trend is an Open Source project that generates and gathers timing data of build processes. The aggregated data is used to create charts to visualise trends of the build process.
These trends can help you gain insight in your build process : which stages take most time? Which stages are stable or have a fluctuating duration? Is there a decrease or increase in average build duration over time?
With these insights you can improve the stability of your build process and make it more efficient.

The generation of timing data is done with either a client or using Buildtime Trend as a Service.
The Python based client generates custom timing tags for any shell based build process and can easily be integrated. A script processes the generated timing tags when the build is finished, and stores the results.
Buildtime Trend as a Service gets timing and build related data by parsing the logfiles of a buildprocess. Currently, Travis CI is supported. Simply trigger the service at the end of a Travis CI build and the parsing, aggregating and storing of the data is done automatically.

The aggregated build data is used to generate a dashboard with charts powered by the Keen.io API and data store.

Check out the website for more information about the project, follow us on Twitter, or subscribe to the community mailing list.

Tuesday, January 13, 2015

What I learned from 365 days of contributing to Open Source projects

Today I reached a 365 day commit streak on GitHub, with over 2300 commits to Open Source projects in that period. In this post I'd like to share my experiences during this past year and the lessons I learned.

Github contribution overview

It started one year ago, on January 14th, 2014, the day I returned from a two week trip to Malaysia. I didn't take a laptop or smartphone on that trip, in order to be 'disconnected' from PC, internet and E-mail for some time. I've taken a habit to have a 'unplugged' holiday about once a year.
I had a streak of over 100 days running before I left on holiday, and had reached 2000+ commits during that year, so I was eager to start committing again, to keep the running total of commits close to 2000 and to start building a commit streak again.
I don't remember if I had a clear goal at that time of the total consecutive days of committing to Open Source projects I aspired to reach. I guess at first I wanted to match the previous record and see how much further I could get.

At the end of June, I got inspired by Josh (@dzello) from Keen.io who had pledged to commit to Open Source projects for 365 days in a row. I had an extensive streak going on at that time, so I decided to try and reach a 365 day streak as well.

Until then it had been fairly easy to keep the streak going. Doing at least one commit every day is not that hard, and I usually did more than one. I was working on my Android app and I started working on what I called 'my side project' at first. In the last few months my focus has shifted to that 'side project', making it my main project basically, but that's a different story.
So I had plenty to do and I was well motivated to work on my projects regularly, so it was easy to keep committing daily.

Until summer I didn't do any long trips, so I was either at home at some point during the day or had my laptop with me (when going to Berlin for LinuxTag, for example) so finding a few minutes every day to do at least one commit wasn't a big challenge. Although sometimes, it required some planning.
If I had a social, cultural or sports activity planned in the evening after work, I planned for an 'easy' commit on those days, usually cleaning up some code, fixing coding style, writing a small test, improving documentation or doing a few translations. I kept the bigger work, implementing a new feature, figuring out an API or framework, or doing some bigger refactoring for days when I had more time available.

Then summer arrived and I planned to go on a climbing trip for a week. I was in doubt if I would have time and opportunity to keep committing during the trip. But in the end I decided to take my laptop and give it a try. I worked on bash script to crop and scale Android screenshots that week, something I could easily develop and test without access to internet. On some days I barely managed to contribute, finishing the commit only a few minutes before the end of the day, but in the end I managed to keep the streak going.

With this hurdle taken I imagined reaching the 365 day goal was achievable. I didn't know back then I was to go on a few long weekends to Fontainebleau during the Fall, but again I took my laptop with me on the trip and found time to contribute some code.

In the end of October I went to California for the Google Summer of Code 10 year Reunion and I had the opportunity to meet Josh, and Justin, also from Keen.io. Josh  published a blogpost by that time explaining why he ended his commit streak at Burning Man, and why he wasn't planning on starting the streak again.

I read his post, and it got me thinking. Is this continuous streak a good thing? Sure, it was a motivation on its own, you want to keep going because you don't want to break the streak, you'd have to start all over again for a long time to reach the same number of consecutive days.
Some days you don't have time, or you've had a rough day and don't feel like turning on your PC and doing the required commit for the day, but would rather do something else, forgetting about that ongoing streak.

But I decided to go for it and finish the pledge to reach 365 days of committing to Open Source projects. I found out that my motivation wasn't only in keeping the streak going, but mostly in making progress with my projects.

Now that I've reached the 365 day goal I've come to some conclusions:

  • Setting a goal helps to keep you going, but it doesn't necessarily has to be a streak of consecutive days commiting code. Josh mentioned this in his blog post as well, there are other metrics or goals you can aspire. Choose one that works for you and that is realistic.
  • A minimum of one commit per day worked for me, and usually I reached more (6,4 per day on average, with a maximum of 27 at some point). But it would be harder for me to set goal of, for example, 30 commits per week. It would put pressure on me every week to reach that goal and it would be counterproductive, for me at least.
  • Now that I've reached this 365 day goal I will keep the streak going as long as I'm comfortable with. As I mentioned, the one commit a day goal works for me as long as it doesn't interfere with my other commitments : I have a day job and regularly enjoy social, cultural and sports activities.
  • Next time I'm going away for a few days, being it a holiday or a climbing trip I will not take my laptop with me. It will break my streak, but I'm OK with that. Disconnecting from everything for a few days every once in a while is more important to me. Afterwards I'll probably pick it up again and start a new streak, but it doesn't matter how long it will be. I'm glad I reached the 365 days goal, but I don't necessary feel the need to repeat it.
  • As mentioned earlier, I found that my motivation lies in working on my projects, in seeing progress as I continue adding features and improving them.
  • I noticed a few similarities in motivation for doing sport (and other) activities. When you're running, for example, it helps to set a goal (a total distance or an average pace to reach) or a metric (once or twice a week, no matter how long the distance or time spent). Choose one that works for you to keep you motivated. But also allow yourself to take break if you need one and pick up later again. In the end you should enjoy the activity, setting a goal is just a way to keep you going, but the fun of doing the activity should drive you.
Many thanks to Josh to inspiring me to reach these conclusions, to all who supported me during the past year and good luck to everyone aspiring a goal, being it a commit streak or something else.

Kudos to those who still have a very long commit streak going!

Thursday, January 01, 2015

Happy 2015!

I wish you all an exciting 2015 in good health, with a lot of fun and big achievements in your projects! Good luck and joy to all my friends who are expecting a child this year!

Reviewing 2014


Well, 2014 was quite busy. Looking at my plans for 2014 a lot more happened than I expected : I learned Python when I started a new project, visited 7 capital cities and 3 continents, did a few climbing trips and got to visit San Francisco and Yosemite again :

  • celebrated New Year in Cebu, Philipines
  • visited Malaysia (Kuala Lumpur, Melakka, ...), Singapore and Hong Kong
  • bought a Google Nexus 5
  • attended FOSDEM 2014
  • resigned as a phpMyAdmin team member, creating some more time for other projects
  • finished a first blue route at Bleau
  • coorganised an info session about Google Summer of Code at Ghent University
  • started working on a tool to generate a trend graph of a build process, my first Python experience
  • attended Newline 0x04 and talked about reducing iptables configuration complexity
  • attended LinuxTag 2014 and talked about 'Reducing iptables configuration complexity' (presentation slides)
  • Finished a 10km race (Gentse stadsloop) in less than 55 minutes
  • Visited Maker Faire Paris : A lot of interesting stuff, mainly 3D printers, but some with a twist : pancake maker, an industrial welding robot mounted with an extruder, lots of hinges, bearings and other stuff printed ready to be used : no need to assemble
  • First time to visit Paris, I finally got to see the Eifel tower, Avenue des Champs Elysées, Arc de triomphe, Le Louvre (outside), Notre Dame, La Seine, Musée d'Orsay, Musée Rodin, Montmartre and Sacré Coeur
  • Released version 0.3 of Get Back GPS
  • Participated in a climbing training in L'Argentière-La Bessée and received a certificate for lead-climbing  and multi-pitch climbing (KVB3), had a lot of fun : climbing a lot and sending several 5b's and 5c's lead-climbing, some of them on sight.
  • Visited Amsterdam, the 6th capital city I went to this year
  • performed a lead-climber's fall at Klimax II
  • did a 55km cycling trip around Ghent
  • Donated blood for the first time
  • Released the first version of Buildtime Trend, a tool to create visual trends of  a software build process, written in Python and JavaScript
  • GetBack GPS had more than 10 contributors during 1 month, most of them are translating the app
  • Ran 16km/10mi for the first time
  • Spent a weekend in Fontainebleau with Maxime, Seba and Wolf, opening some routes.
  • Went to San Francisco to attend the GSoC 10th Anniversary Reunion and spent a few days in San Francisco and did a trip to Yosemite with Madhura Jayaratne. Shared a few beers with Justin and Josh of Keen.io, talking about Open Source commit streaks and Buildtime Trend.
  • Released GetBack GPS 0.4, introducing 7 more languages.
  • Spent a long weekend climbing in Fontainebleau with Peter, Dorinne, Cécile, Stef, Aline, Senne, Nik, Chris, Andreas, Luke and Barbara, climbing several yellow and blue routes.
  • and a second blood donation
  • finished a red climbing route
  • traveled to Lisbon.
Things to do in 2015:
  • Continue working on Buildtime Trend : offer it as a service (SaaS), add more stats, support more CI environments, ... 
  • Climb as much as possible, both indoor and outdoor, with trips to France during the Easter and summer holidays, and weekend trips to Fontainebleau or one of the climbing areas in the south of Belgium.
  • Visit Open Source and related conferences : FOSDEM, LinuxTag, EuroPython, DebConf and KeenCon.
I'm looking forward to where 2015 will bring me. Looking back at 2014 it is bound to be an exciting year again.

Thursday, October 09, 2014

Custom multiseries trend using Keen.io API

The initial goal was to create a trend of event data related to the time of day or day of week when the event occured. Later on, it seemed like a good idea to display different timeframes on the same trend.

The end result shows a trend, calculating an average value of a metric (buildtime duration, in this example) for all events that occured in the same time interval (day of week, in this example), for different timeframes (last week, month and year, in this example), which are displayed as different series in the same chart, to be able to compare them and visually notice an evolution or an anomally.

This trend is part of the Buildtime Trend project, you can see the code in action here.

Read on to see how it is done.
The Keen.io service and API is used to store, analyse and visualise the event data. I'd like to refer to the Keen.io tutorials on how to create a query and generate a chart.

Generate and group by time intervals


First of all, the event data has a timestamp, so in a simplified example, an event would look like this :

  { id: "1234abcd", duration: "97", timestamp: "2014-10-09T18:32:14Z"}

But to group events on time intervals, like day of week, or hour (time of day), the timestamp  has to be split into its components (thanks to Ryan Spraetz of Keen.io for the suggested workaround), for example :

  {id: "1234abcd",
    duration: "97",
    timestamp: {
      isotimestamp: "2014-10-09T18:32:14Z",
      day_of_week: 4,
      hour_24: 18,
      hour_12 : 6,
      hour_AMPM : PM,
      ... 
    }
  }


Look here for the code to split the timestamp (in Python) and a full example of a split timestamp.

A query to group events by day of week, calculating an average value of duration, for all events of the last week, would look like this :

var queryLastWeek = new Keen.Query("average", {
  eventCollection: "builds",
  timeframe: "last_week",
  targetProperty: "duration",
  groupBy: "timestamp.day_of_week"
}); 
 
Using an example from the Keen.io tutorial, you could easily create a chart with one series of data.
If timeframe is changed to 'last_month' or 'last_year', you get the same query for a longer timeframe.

Combine several queries in one chart


So now we have 3 queries : queryLastWeek, queryLastMonth and queryLastYear

Which are passed as parameters to the Keen.io client.run method, where the result of the 3 queries are merged to one array by method mergeSeries (see below). This merged array (chart_data) is passed to keen.Visualisation to draw the chart you can see at the top of this post :
var request = client.run([queryLastWeek, queryLastMonth, queryLastYear], function() {
  series_captions = ["Last week", "Last month", "Last year"];
  index_captions = ["Sun", "Mon", "Tue", "Wed", "Thu", "Fri", "Sat"];
  chart_data = mergeSeries(
    this.data,
    index_captions,
    "timestamp.day_of_week",
    series_captions
  );
  // draw chart
  window.chart = new Keen.Visualization(
    {result: chart_data},
    document.getElementById("chart_avg_buildtime_weekday"),
    {
       chartType: "columnchart",
       title: "Average buildtime per day of week",
       chartOptions: {
       vAxis: { title: "duration [s]" },
       hAxis: { title: "Day of week" }
    }
  });
});

You can find the full code here.

Merge data series

First this methods creates a multilevel array with i rows (one for each series, in this example i = 3 (week, month, year)) and j columns (one for each index value in the query, in this example j = 7 : 'Sun' to 'Sat').
Then the methods takes the Keen.io data array, with the results of all queries as a parameter, loops over the result from each query and assigns the values to the corresponding index in a multilevel array. As a result all values corresponding to 'Monday' will be in the same place in the array.
function mergeSeries(data, index_captions, value_caption, series_captions) {
  chart_data = [];
  // create and populate data array
  for (i = 0; i < index_captions.length; i++) {
    chart_data[i]={caption: index_captions[i]};
    // populate all series
    for (j = 0; j < series_captions.length; j++) {
      chart_data[i][series_captions[j]] = 0;
    }
  }
  // loop over all query result sets
  for (j = 0; j < data.length; j++) {
    timeframe_result = data[j].result;
    timeframe_caption = series_captions[j];
    // copy query data into the populated array
    for (i = 0; i < timeframe_result.length; i++) {
      index = parseInt(timeframe_result[i][value_caption])
      chart_data[index][timeframe_caption] = timeframe_result[i]["result"];
    }
  }
  return chart_data;
}

Some improvements

Some ideas to make it more efficiently:
  • A special 'groupby' parameter for timestamps as part of the Keen.io API, would avoid splitting a timestamp and storing all the components in the database
  • Currently, 3 almost identical queries are created to generate the results for the different timeframes. It would be more efficient to repeat the same query several times with only the timeframe changing. Still something to investigate.

Friday, September 19, 2014

How I got more relaxed by no longer commuting by car

Yesterday was car free day, at least in Belgium, and by a happy coincidence I came across an article that pointed out a correlation between mental well-being and the means of transportation when commuting to work. It turns out that not using a car, fe. going by bike, on foot or by public transport increases your mental health. The author wonders about the reason for this.

I'm not a psychologist, nor have I done scientific research to investigate this, but from my personal experience, I can think of a few reasons why not driving by car to commute is better for you.

A few years ago, I was commuting daily by car. Construction works were going on for a few months, so every morning I spent 20-30 minutes in a traffic jam (on top of the 30 minute drive it took me to get to work).
Those 20-30 minutes of waiting, driving slowly, accelerating and breaking again, more waiting, ... well, it annoyed me, and I guess a lot of other people don't like traffic jams either.

A few months later, I was told the contract of my company lease car was about to end and I would get a new one.
Then I started wondering if I really liked spending that much time in traffic jams every day, 50-60 minutes of doing nothing else but stare at the car in front of me. So I started looking for alternatives. It turned out there was a train station at walking distance from my office, and it would take me 50-60 minutes to get from home to work. No gain in travel time (and it would take me less time by car if there would be no traffic jam), but I would spend about 45 minutes in a train, not having to pay attention to the cars in front of me, not having the stress and boredom of waiting in a traffic jam. I could listen to some music, read a bit, take a nap, stare out the window enjoying the scenery passing by or having a chat with a fellow commuter.
So instead of spending about an hour getting annoyed and stressed, I could relax while the train driver got me to work and I could get some things done in the mean time.

So I declined the offer of a new lease car and decided to commute by train. I couldn't have made a better decision. From that moment on I arrived more relaxed at work and at home. Of course, commuting by train can be stressful as well : delayed or cancelled trains, crowded with noisy people. But I was lucky to have a quiet commuter train in the morning, and I could usually avoid rush-hour in the evening, so I usually had a comfortable commute, arriving at work or at home much more relaxed.

Commuting by train can be annoying as well, if you have to cope with long commutes, multiple stop-overs, delays and crowded trains on a daily basis, as I experienced a few years later on another job (but at least I could still doze off or read a bit).
But I was relieved, when I found a job closer to home that would take me 20 minutes by bike. No reading this time while commuting, but having the daily physical exercise and cruising past rows of waiting cars was enjoyable (I'm not gloating, actually, I took a route through the car free city center, so I didn't see that much cars on my way to work), but I knew that if I would go to work by car I would end up in a traffic jam and it would take me much longer to get to work.

I don't use the car that much anymore, only for longer drives, places that are hard to reach by public transport, or when transporting heavy or bulky loads. And I like it. I can't imagine losing multiple hours waiting in traffic jams every week.
Overall I'm more relaxed because I don't get annoyed waiting, can do some enjoyable things while commuting or get some physical exercise (which is also known to reduce stress levels).

A a consequence you have to make some compromises and it will take some extra planning, but it's worth it.

Wednesday, August 06, 2014

Buildtime trend v0.1 released

Everyone likes graphs, trends and stats. This is also true when building software. Did you ever want to know how the total duration of your build process evolved over time? Did you ever wonder why your build process took so much longer all of a sudden, trying to figure out what part of the build process was responsible for this?

Build time trend example (click for realtime stats)

Buildtime trend lets you measure the time of all parts of the build process and creates nice graphs showing how long each build stage takes, and more.
You can easily integrate it with your Travis CI build process, or integrate it with your build process.
The timing data of your build process is then stored, analysed and visualised, using the Keen.io API, resulting in nice graphs and charts.

In a future version, Buildtime trend will be able to get timing data from Travis CI, without having to manipulate the build config file. Support for other CI environments is on the roadmap as well. And of course, a lot more stats and charts and trends.

Suggestions and comments are welcome. Follow us on Twitter or submit a feature requests to the issue tracker.

Update : An example script in release v0.1 didn't handle extracting the release tarball well, it is fixed in v0.1.2

Saturday, July 12, 2014

GetBack GPS for Android v0.3 is released

Get the latest version on F-Droid.

Arrow pointing to destination and compass indicating North

GetBack GPS for Android v0.3 is now available. It adds a realtime compass and detects your travel direction. This way the arrow pointing to your destination will still point in the right direction, even when travelling backwards.
And there are some small UI improvements.

The app is now also available in Danish, Brazilian Portuguese, Traditional Chinese and French. A big thanks to the translators and supporting services!

A complete list of features and available languages is available on the website.


Friday, July 11, 2014

Remove bars from Android screenshots

How to remove the Status Bar at the top and return/home/screens button bar on the bottom/side from Android screenshots, using commandline ImageMagick.

Portrait screenshot

Command :

convert -size 1080x1920 -extract 1080x1700+0+75 original_screenshot.png screenshot_after.png

1080x1920 is the original size of the image (portrait)
1080x1700 is the new size, +0+75 the x and y offset where the extraction starts
(sizes may differ if you have a phone with a different screensize and resolution)


Result:
Original portrait screenshot, before cropping
After cropping

Landscape screenshot

Command :

convert -size 1920x1080 -extract 1792x1005+0+75 original_screenshot.png screenshot_after.png

1920x1080 is the original size of the image (landscape)
1792x1005 is the new size, +0+75 the x and y offset where the extraction starts

(sizes may differ if you have a phone with a different screensize and resolution)


Result:

Original screenshot (landscape), before cropping

After cropping

Monday, June 23, 2014

File recovery using foremost

Quick note on using foremost to retrieve files from a harddrive with a faulty partition table :

sudo foremost -dT -i /dev/md2 -t jpeg -o /path/to/restore2/

This scans /dev/md2 hd, looking for jpeg files and puts the restored files in /path/to/restore2/
Foremost can retrieve a lot of different file types (including images, MS Office files, PDF's and zipfiles), look at the man pages for a complete list. It is also possible to define your own filters.

Modify (or copy first) the foremost.conf file and add a line  for every file type fe. :

ex1   y   4096000  \x50\x4b\x03          \x74\x78\x74
ex2   y   4096000  \x50\x4b\x03???\x44   \x74\x78\x74

where you specify :
  • file extension
  • case sensitive pattern (if ASCII codes are used in the pattern)
  • maximum size of a file in bytes
  • starting pattern
  • end pattern
The pattern can be in hex code or ASCII, use a ? as a wildcard for one character. In the second example above, a wildcard for 3 characters is added.

Now run foremost, using the custom config file :


sudo foremost -dT -i /dev/md2 -c /tmp/foremost.conf -o /path/to/restore2/

This scans /dev/md2 hd, using the rules in /tmp/foremost.conf and puts the restored files in /path/to/restore2/

Thursday, March 06, 2014

Google Summer of Code 2014 meetup at Ghent University

Wednesday evening, March 5th, 19u, about 30 students of Ghent university (Belgium) showed up for an info session about Google Summer of Code 2014. Some of them already heard about it, but for most of them it was new.

Google Summer of Code is a yearly initiative of Google, this year held for the 10th time, to introduce students in higher education to Open Source development, by offering them a stipend of 5500 USD for 12 weeks of coding on an Open Source project during the summer. It gives the students realworld experience, writing code that will be used by many users worldwide, collaborating with the teams of the Open Source organisation they will contribute to, improving their teamwork and communication skills.

After a brief introduction about the program, 4 (of the 190 selected for GSoC 2014) Open Source organisations presented themselves.

Sage is an Open Source collection of mathematical tools, ranging from solving differential equations to plotting functions. Some of their projects this year focus on improving the user interface, but there is also a need for adding mathematical tools, fe. for knot theory.

GNU Octave is also related to mathematics, but is mostly used for simulations and numerical computations. Their ideas pages contains several projects, one of them is adding a library for doing finite element simulations.
Both these projects are interesting for students with an affinity for maths and programming, but also for students wanting to improve the GUI or add other supporting tools.

Next up was the phpMyAdmin project, a webbased user interface for MySQL databases. Having participated to GSoC for many years, the list of projects to work on range from improving the AJAX error reporting tool that was added in GSoC 2013, to also report PHP errors, over a tool to normalize and check the structure of a database to interface improvements. If you are proficient in PHP or JavaScript and interested in databases, one of these projects might be for you.

MuseScore was the last project to present itself. It is a free and Open Source music annotation software, but there is also a version for tablets and an online music sheet library to share your compositions. Their ideas for this year's GSoC range from support for visually impaired users to tools for adding lyrics to a music score. Interested students should be proficient with C++ and Qt.

All projects mentioned that communicating with the development team and the mentors, using either the IRC channel or the mailing list is very important and the best way to get into contact with them.

At the reception afterwards, the mentors of the Open Source projects talked to the students answering their questions about GSoC, on how to apply, how to write a good proposal, and many more question that are also answered in the GSoC FAQ.

Thanks to the Open Source organisations (SAGE, GNU Octave, phpMyAdmin and MuseScore) for their talks and sharing their experience, and to the student associations (VTK, Zeus WPI, Ceneka) and UGent for their help in organising the event.

Sunday, February 09, 2014

An impression of FOSDEM 2014

Sunday evening, 19:30, leaving Brussels by train, heading home.
48 hours earlier I arrived here for FOSDEM : another amazing weekend of Open Source, sharing knowledge, meeting people, getting new ideas, geekiness, and well, also a bit of beer.

Opening talk of FOSDEM 2014
With more than 500 talks and presentations spread over 2 days in 22 rooms held at the ULB in Brussels, with 5-10 thousand visitors, it is impossible to attend and see everything. Luckily, thanks to an amazing team of origanisers and volunteers everything went smoothly and all talks are recorded and the videos will be available soon.

Some highlights, some inspiration and some ideas to work on :